Why I Built a Small Observability Stack

Over the last few years, my systems have become more distributed: multiple services, containers, and external dependencies all talking to each other. When something breaks in that world, traditional monitoring (CPU, memory, a handful of logs on a single box) doesn’t give enough context to answer the real questions:
- What exactly is broken?
- Where in the request path is it failing or slowing down?
- How do logs, metrics and traces relate to each other?
To explore better answers, I put together a small end‑to‑end demo stack using Prometheus, Loki, Tempo and Grafana, plus a couple of example services (Go and Rust) that emit logs, metrics and traces. The source code is available here: cozi-dev/monitoring-stack.
This post is a walkthrough of that stack and how I use it day‑to‑day as a developer.
High‑Level Goals
The idea is not to build a “perfect” production setup, but a minimal playground that lets me:
- See system health via metrics
- Understand behaviour via logs
- Trace requests end‑to‑end across services
If you want a concrete way to feel what observability gives you (instead of just reading theory), spinning up this stack locally is a great starting point.
Stack Overview
At a high level, the demo includes:
- Example services (Go, Rust, etc.)
- Expose HTTP
/metricsendpoints for Prometheus. - Write logs to stdout.
- Emit distributed traces via OpenTelemetry.
- Expose HTTP
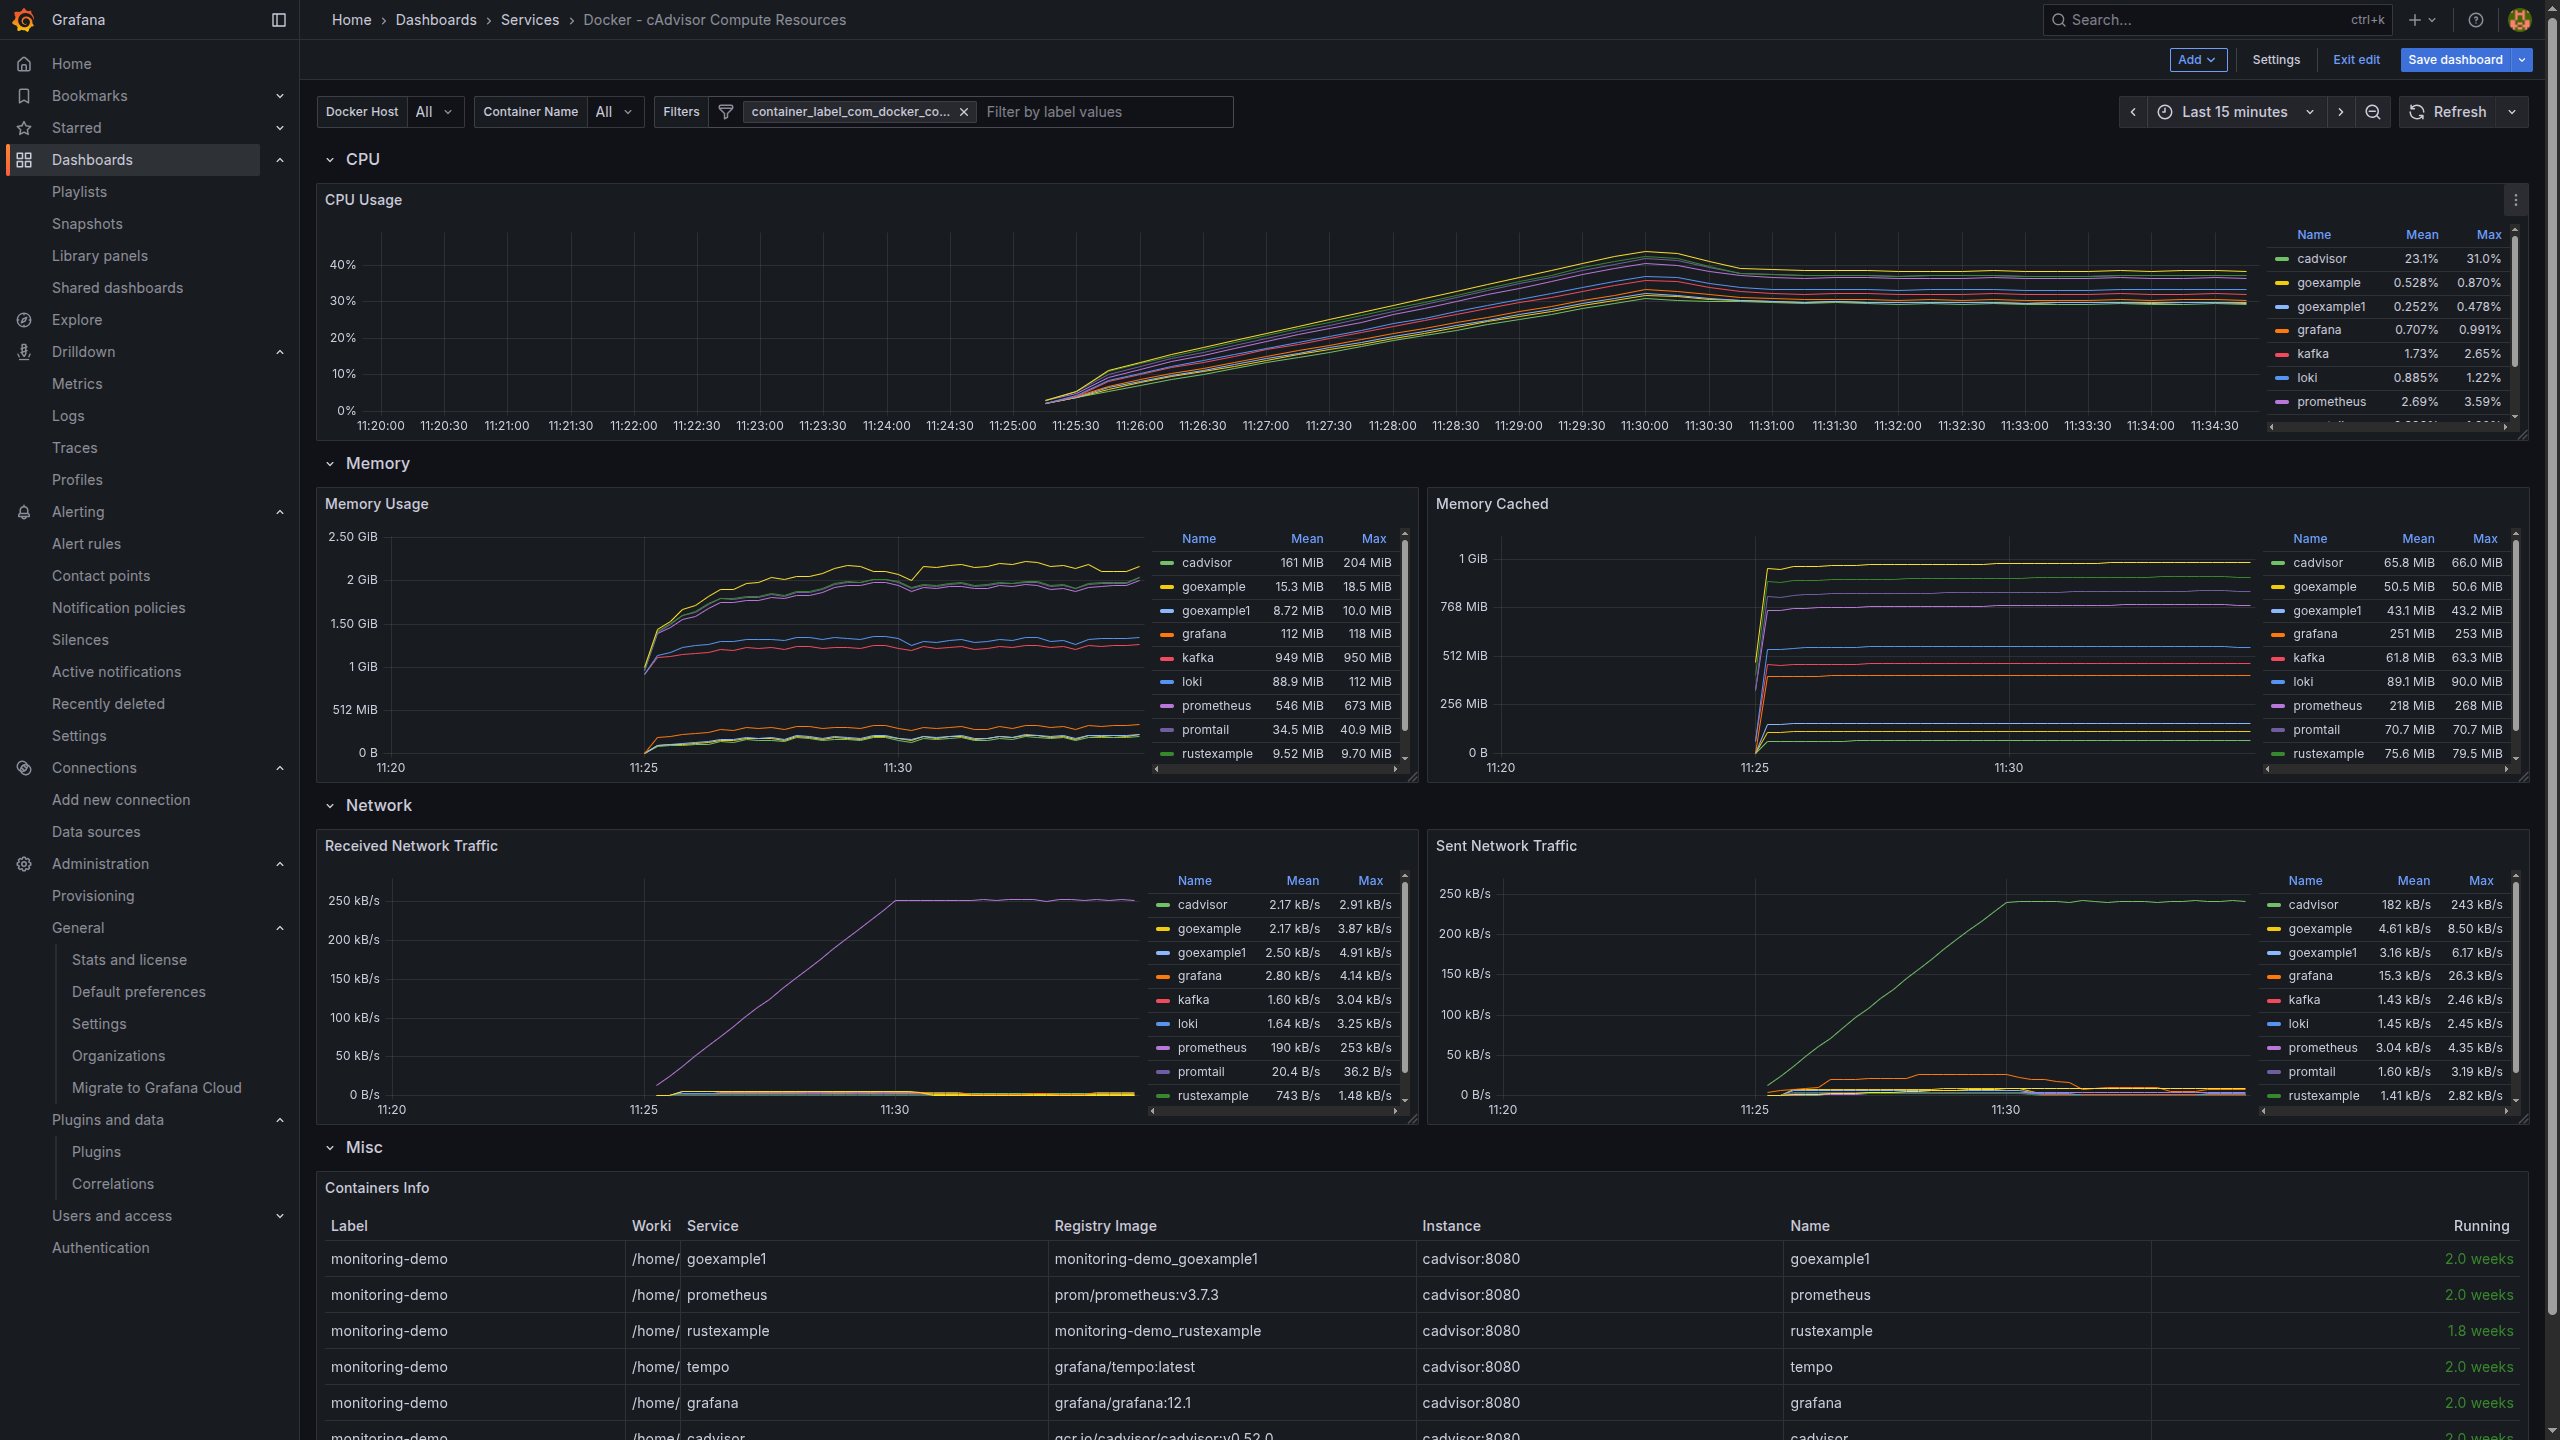
- cAdvisor
- Runs as a container on the host.
- Collects CPU, memory, filesystem and network metrics for each container and the host.
- Exposes a Prometheus‑compatible metrics endpoint.
- Prometheus
- Scrapes metrics from the services and from cAdvisor.
- Stores time‑series data and powers metric queries and alerts.
- Promtail
- Tails Docker container logs.
- Enriches them with labels (service, container, environment, etc.).
- Ships everything to Loki.
- Loki
- Stores log streams indexed by labels instead of full‑text.
- Optimised for cheap log storage and fast queries in Grafana.
- Tempo
- Receives and stores traces (groups of spans) from the services.
- Lets you search and inspect traces via Grafana.
- Grafana
- The single UI that connects to Prometheus (metrics), Loki (logs) and Tempo (traces).
- Provides dashboards, logs exploration, and trace visualisation.
- Makes it easy to jump between metrics ↔ logs ↔ traces during an investigation.
From a developer point of view, Grafana becomes the “home base” for understanding how the whole system behaves.
Data Flow: Metrics
For metrics, the flow looks like this:
- Services and cAdvisor expose metrics endpoints
- Application services expose
/metricswith counters, histograms, etc. - cAdvisor exposes container and host metrics (CPU, memory, disk, network).
- Application services expose
- Prometheus scrapes on a schedule
- Periodically hits those endpoints.
- Stores time‑series such as request rate, error rate, and latency percentiles.
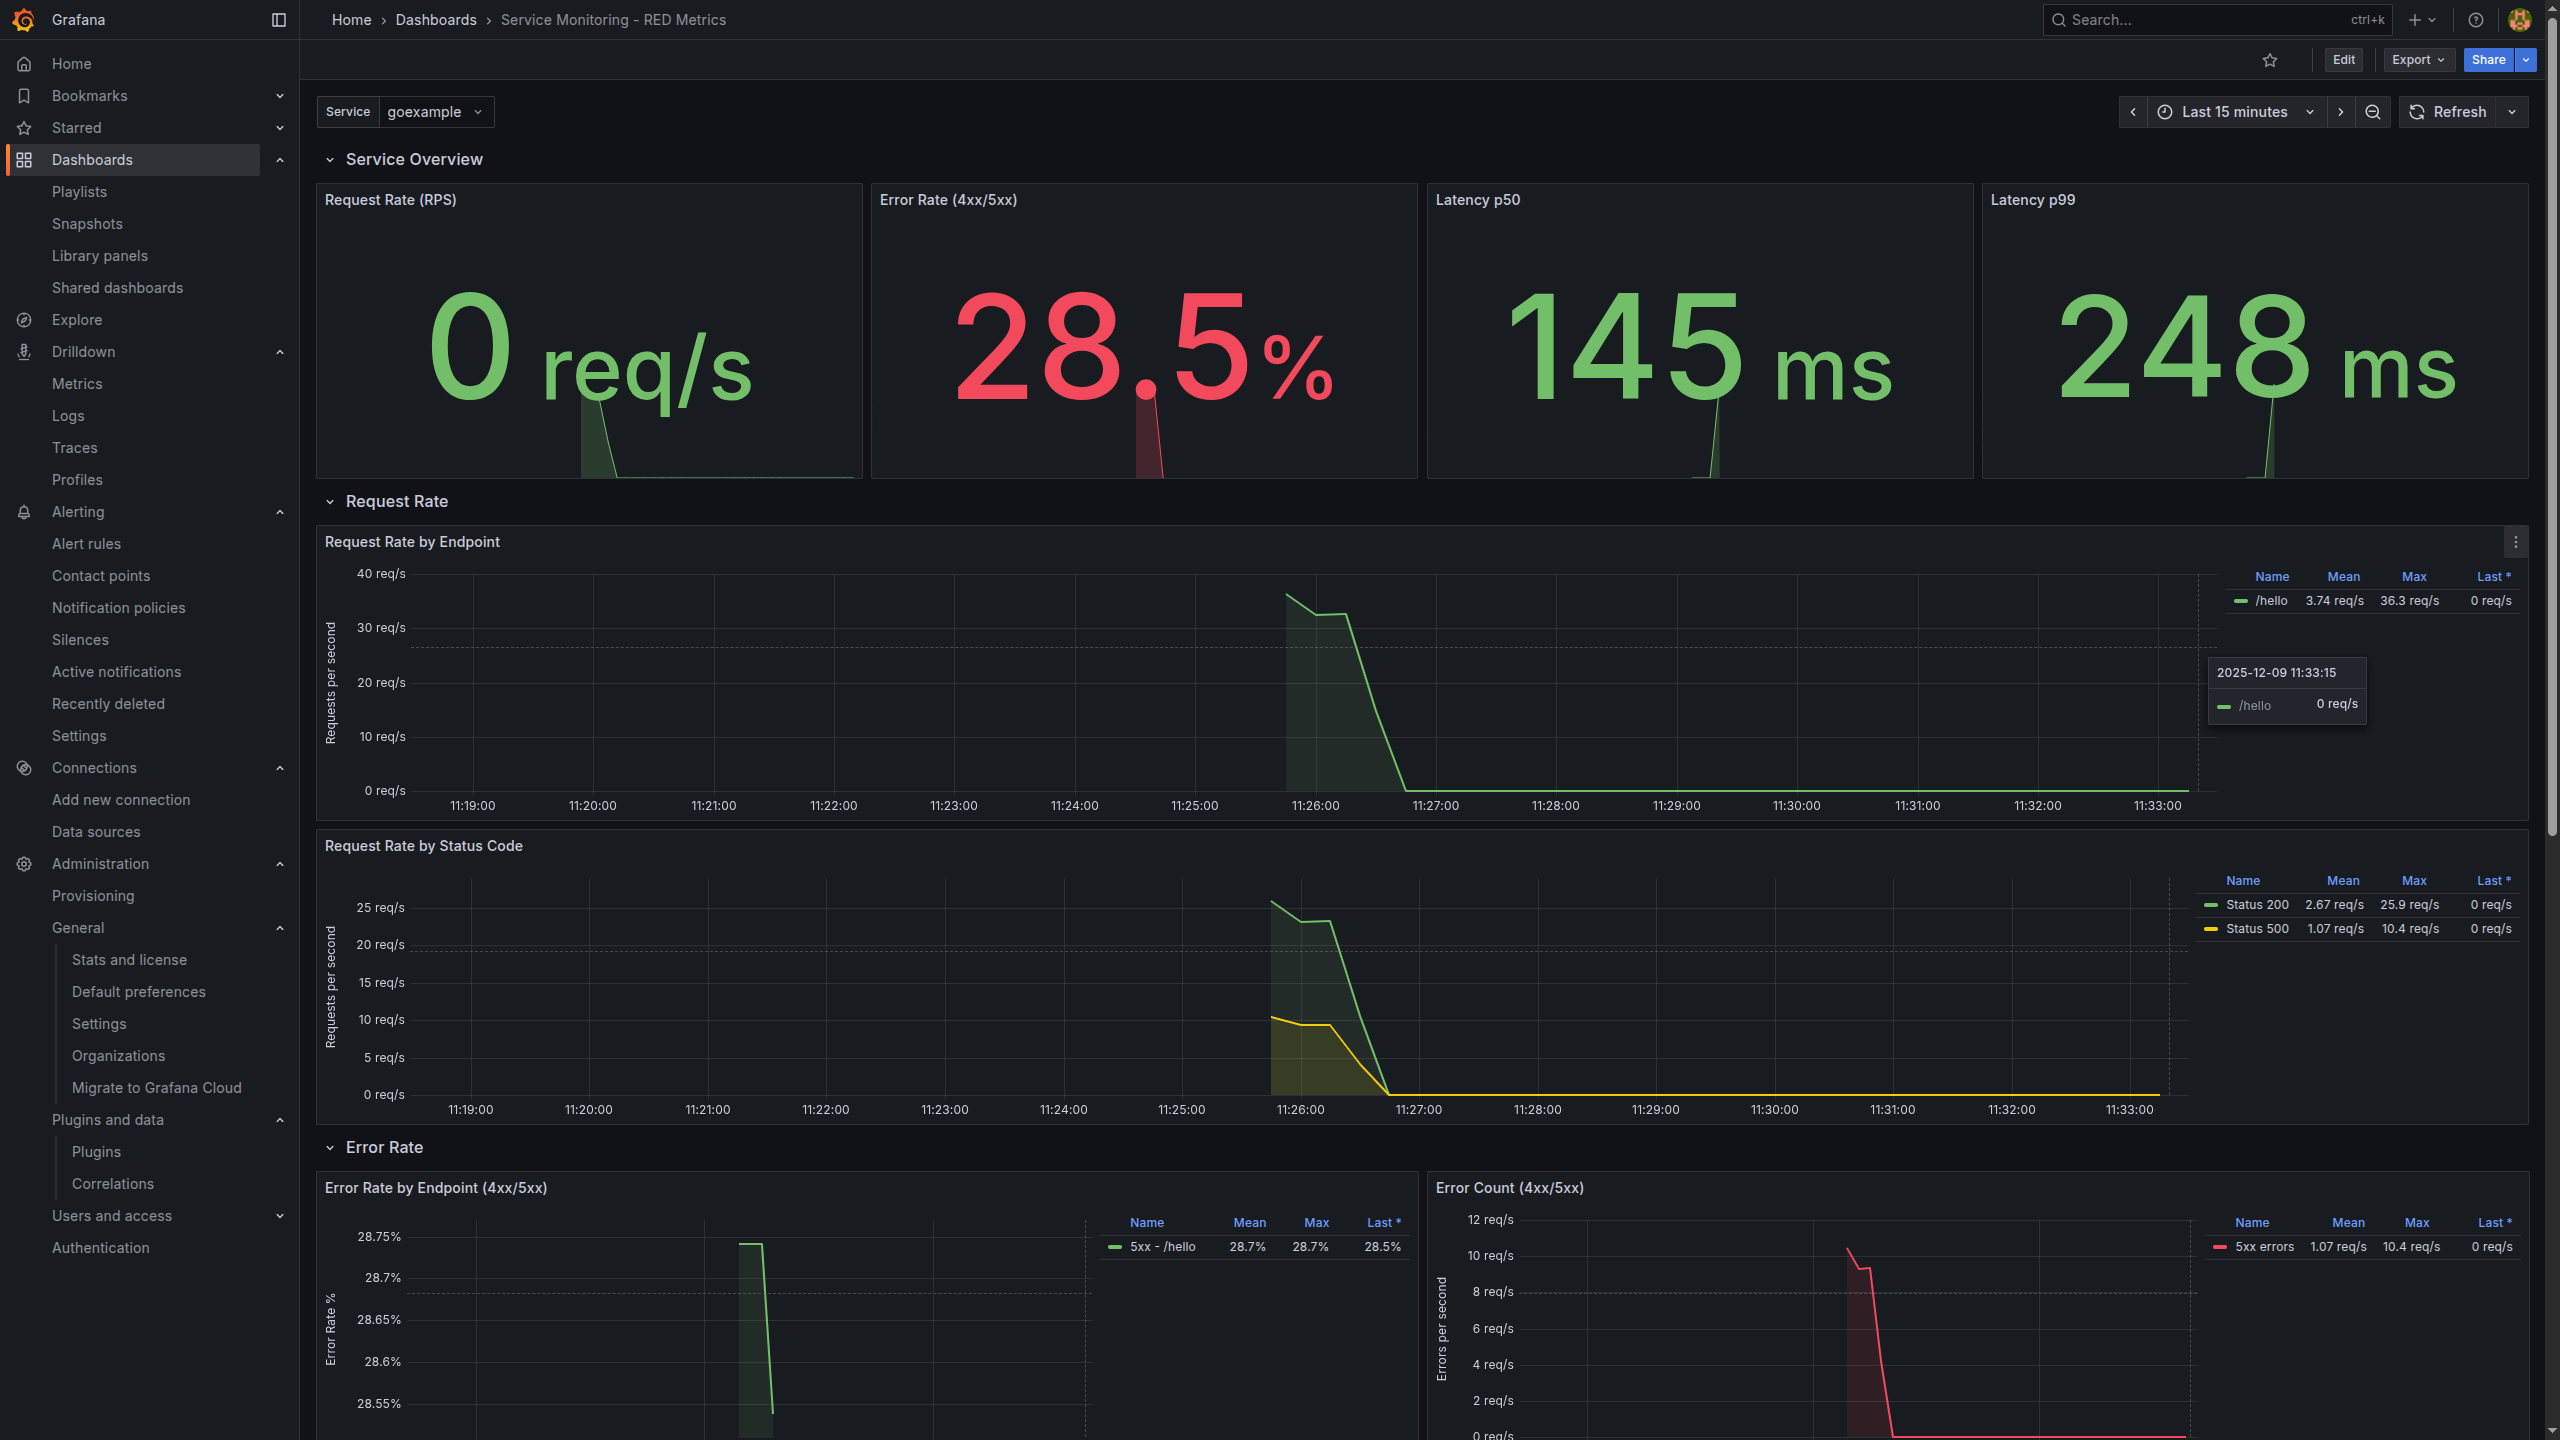
- Grafana visualises
- Using the Prometheus data source, I build panels like:
- Request rate (RPS) per service
- Error rate (4xx/5xx)
- Latency (p50, p95, p99)
- Container/host resource usage (from cAdvisor)
- Using the Prometheus data source, I build panels like:
This gives us the classic SRE‑style view: how fast, how often, and how broken things are.
Data Flow: Logs
Logs are still the best way to understand what a service thought it was doing at a specific moment. In this stack:
- Services log to stdout/stderr
- No log files, just container logs.
- Docker captures container logs
- Standard Docker logging mechanism.
- Promtail tails Docker logs
- Reads logs from Docker.
- Attaches labels like service name, container, environment.
- Sends everything to Loki.
- Loki stores log streams by labels
- Instead of indexing the entire log body, it focuses on labels.
- That’s why Loki is a good fit for high‑volume, low‑cost logging.
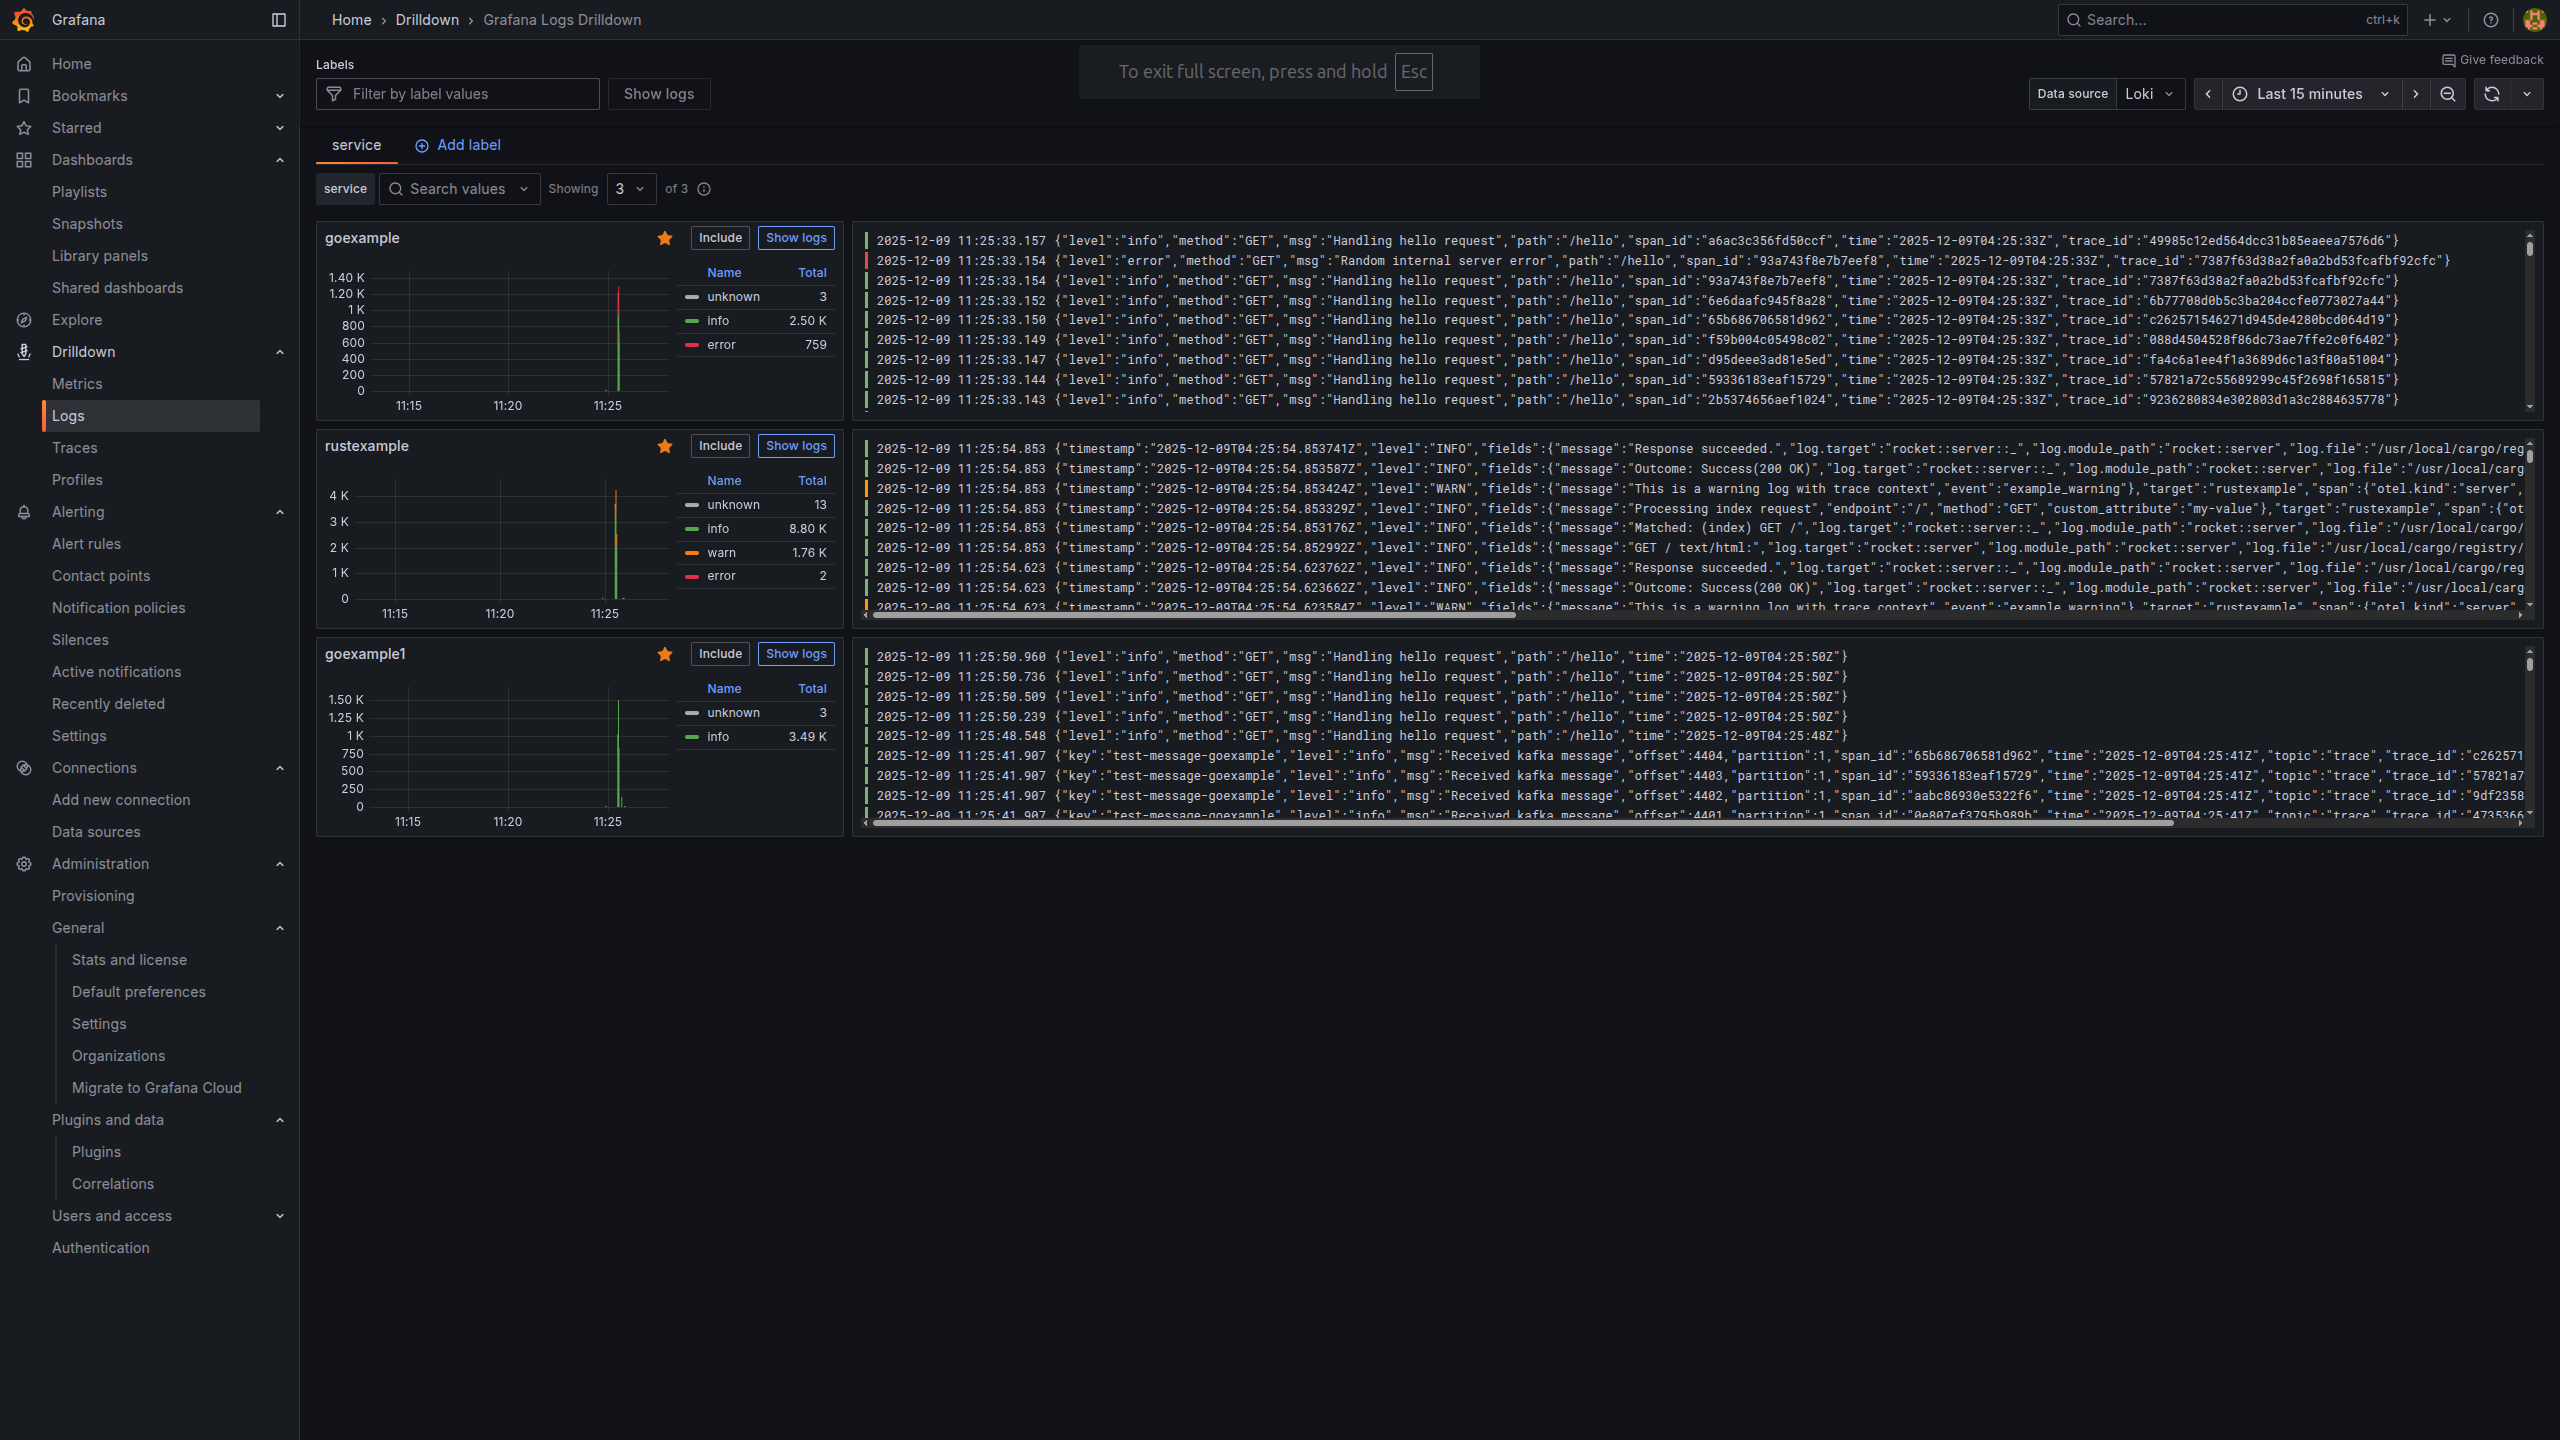
- Grafana queries Loki
- In the Explore view, I can filter logs by:
- Service (e.g.
service="payments") - HTTP status or path
- Correlation IDs
- Service (e.g.
- In the Explore view, I can filter logs by:
Once you get used to label‑based log queries, it becomes very natural to drill into just the context you care about.
Data Flow: Traces
Even with good metrics and logs, it can still be hard to see how a single user request flows across many services. That’s where tracing comes in:
- Services are instrumented with OpenTelemetry
- Each incoming request creates a root span.
- Downstream calls (DB queries, HTTP calls to other services, etc.) create child spans.
- Spans are sent to Tempo
- Tempo groups spans into a trace that represents the whole request path.
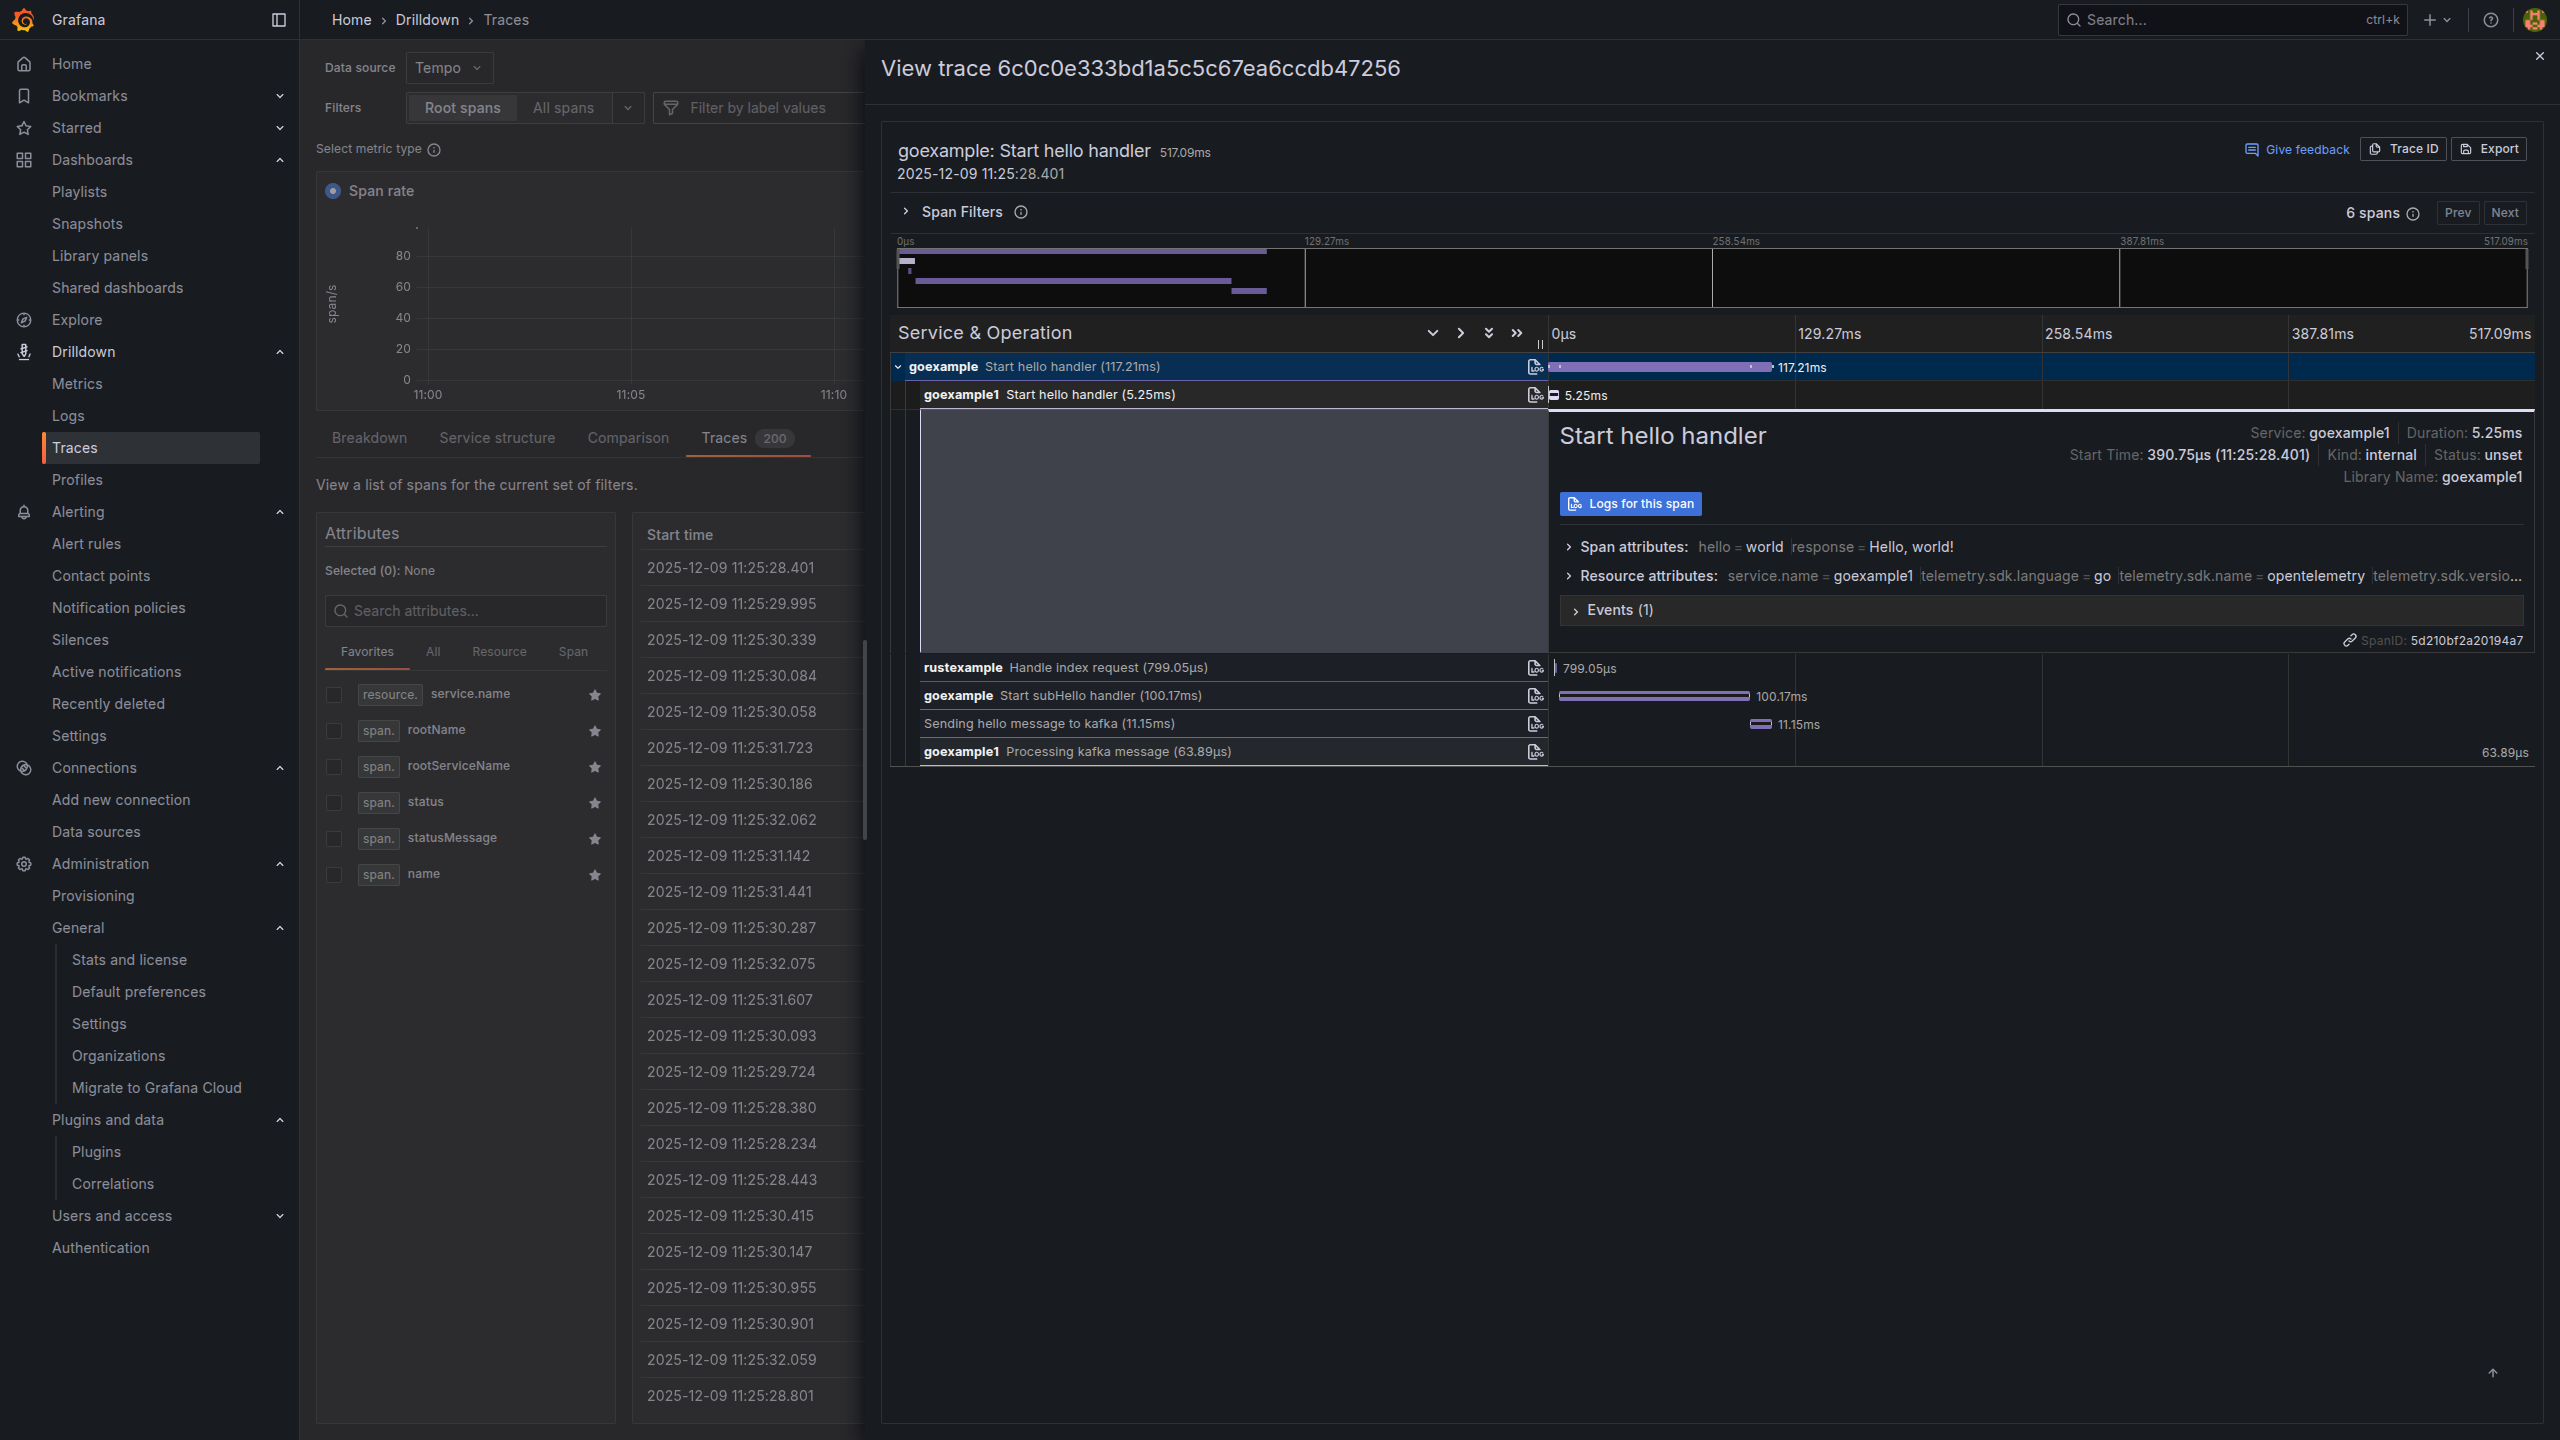
- Grafana visualises traces
- With the Tempo data source, I can:
- Search traces by service, operation or duration.
- See a waterfall view of where latency is introduced.
- Spot failing segments immediately.
- With the Tempo data source, I can:
Traces are especially powerful when you have intermittent or high‑latency issues: they tell you exactly which segment of the request path misbehaved.
A Typical Developer Workflow
Here’s a realistic workflow I use with this stack:
- Notice a spike in errors in metrics
- In a Prometheus‑backed Grafana dashboard, I see a panel where
http_requests_total{status="5xx"}suddenly jumps for one service.
- In a Prometheus‑backed Grafana dashboard, I see a panel where
- Zoom into the problematic time window
- Narrow the time range around the spike.
- Pivot to logs (Loki)
- In Grafana Explore, switch the data source to Loki but keep the same time range.
- Filter logs by service name and maybe error fields or correlation IDs.
- Read the actual error messages.
- Jump into traces (Tempo)
- From the same context, open the Tempo data source.
- Search for long‑running or errored traces in that time window.
- Inspect the slow spans and see which dependency is causing trouble.
- Loop back to code
- Now I know which service, which endpoint, and which downstream call is responsible, and I can go fix it in code.
This tight metrics → logs → traces loop is the main reason I like this stack. It dramatically reduces the “guessing” phase of debugging.
Running the Demo Locally
If you want to try this yourself, you only need Docker and Docker Compose.
Clone the repository:
git clone https://github.com/cozi-dev/monitoring-stack.git
cd monitoring-stack
Start the whole stack:
docker-compose up -d
Once the containers are up:
- Grafana UI:
http://localhost:13000 - Default login:
admin/admin(or whatever you configure) - Preconfigured data sources: Prometheus, Loki, Tempo
From there you can:
- Open metrics dashboards and watch traffic, errors and latency.
- Query logs from any service with labels in Loki.
- Explore traces in Tempo and understand full request paths.
Feel free to break the example services on purpose (add artificial latency, return 500s, etc.) and then use the stack to trace what happened.
Next Steps and Ideas
This demo is intentionally minimal, but it’s close to what you would run in a real environment. Some natural next steps:
- Create richer dashboards and alerts tailored to your domain (Grafana dashboards gallery).
- Link advanced metrics to traces for better correlation (example talk).
- Experiment with OpenTelemetry auto‑instrumentation for your language (OpenTelemetry zero‑code docs).
- Apply this stack to Kubernetes instead of just Docker Compose.
If you’re curious about observability but don’t know where to start, I hope this small stack (and the monitoring-stack repo) gives you something concrete to play with and adapt to your own systems.